
Who Should Get a Body Composition Scan…and Once You Have It, How Do You Read It?
Posted by: Men's Health Boston in Men's Health on July 19, 2024
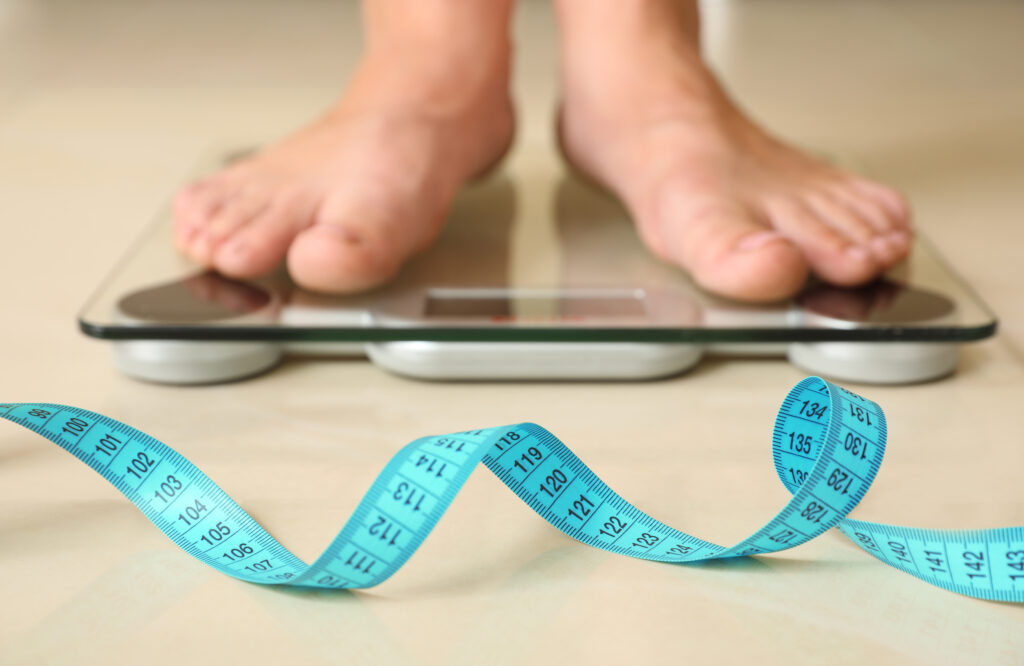
Have you ever found yourself following a rigid dietary and exercise plan all week long – giving up sweets and desserts, focusing hard on portion sizes, and spending hours sweating in the gym – only to jump on the scale at the end of the week and discover you have actually gained weight?!
Or perhaps you have noticed the opposite: you go on vacation to Florence or Rome, indulging in pasta, wine, and gelato for a week, only to return home and discover that your weight hasn’t actually budged at all…
These scenarios (and a million variations of them) are actually quite common, because as it turns out, body weight can be a very finicky thing. What you eat and how much you move are major factors in determining your weight, but they aren’t the only ones. Everything from hydration status, time of day, and even how recently you had a bowel movement can all play a role in what number shows up on the scale (if you don’t believe us, try weighing yourself before and after a trip to the bathroom and see for yourself!).
And anyway, weight is not what we actually care about when assessing your health – at least not on the medical side of things.
What’s wrong with using Body Mass Index (BMI)?
In short, nothing really. It’s a great tool for its intended purpose. When it comes to judging health risks, body weight is a proxy measurement. It’s quick and dirty; you can evaluate large swaths of the population rapidly, compare weight-by-height, and then group people into general “chronic disease risk categories”. This is useful when you are studying massive groups of people. But it all too often fails to appropriately assess individual health risks, because it doesn’t take into account how much of a person’s measured body mass is muscle vs. bone vs. body fat – or importantly, where that fat is stored on the body.
It’s common sense that bodybuilders and couch potatoes aren’t equally healthy, even if they weigh the same amount. But what about someone whose BMI is considered “normal”, but who doesn’t exercise, loves desserts, and carries most of their weight around their midsection? How do they compare metabolically to someone of a higher weight who exercises an hour daily and focuses on healthy, whole foods as the base of their diet?
Decades of research have shown that your personal amount of muscle tissue vs. body fat, and where you carry each, are stronger determinants of individual health risk than body weight or BMI alone.
Why is body composition a better health indicator?
It’s well known that pesky visceral fat (VAT), the body fat stored deep within the abdomen and around the organs, is much more problematic than body fat stored just below the skin (known as subcutaneous fat). Excess VAT is strongly associated with development of all sorts of metabolic disorders, from high blood pressure and insulin insensitivity to high cholesterol and sleep apnea. The more you have, the higher your risk. But accurately measuring and quantifying VAT can be quite challenging, particularly from the outside, which is part of what makes DXA technology so valuable. Using a DXA machine, the same scanner technology we use for bone density scans, we can run body composition analysis to analyze body fat, VAT, and muscle mass with research-level precision – all in a 15-minute scan offered at our Chestnut Hill location.
Because one of our primary goals at MHB is preventive medicine, we also believe that the measurement and quantification of muscle mass is a sorely underappreciated metric for overall health. When we talk about muscle in our clinic, the picture most people have in mind is of their mid-20’s selves, hitting the gym primarily for sport and aesthetic pursuits.
But the inescapable fact is that as you age healthy muscle means independence. Your ability to live autonomously and engage in activities that give you purpose depends heavily on maintaining muscle mass over time, deep into your 70’s, 80’s, and 90’s. And like most important things in life, this is a long-term project that starts with developing a strong base – in your 40’s, 50’s, and 60’s.
Who should get a body composition scan?
Many different groups can benefit from getting scanned. From those looking to gauge the effectiveness of their dietary and exercise routines, to people who simply want a better evaluation of their chronic disease risk, having objective data to compare with benchmarks can be really useful. But there are a few situations where we find body composition assessments particularly useful in our clinic:
- For patients currently on or seeking to initiate weight loss medications or bariatric surgery, DXA allows us to track weight lost from body fat versus muscle tissue, a key concern with both treatments.
- In older adults, it can be used to diagnose muscle wasting and frailty, a condition known as sarcopenia.
- Body composition analysis is one clear way to determine the effectiveness of testosterone replacement therapy (TRT).
Unfortunately, insurance rarely pays for body composition analysis, although HSA funds can often be used to cover the cost. We are committed to offering an affordable rate to all of our interested patients, particularly because we find it so clinically valuable. If you or someone you know are interested in having a body composition scan done, contact our office for pricing options and appointment availability.

How do you read your body composition report?
At MHB, we aim to provide real educational value to our patients, to arm them with the knowledge and tools necessary to be informed decision-makers regarding their health.
As part of that pursuit, we’ve written previously on the blog about how to read and interpret a DXA bone density report. That post became a bit of a beast, and today’s undertaking is no different.
So please note: what follows below is a very technical description of how to read and interpret a body composition analysis. It is designed to be useful to our patients who have already had a scan done, and who want to better understand their report. We advise all patients to review their scans with their medical providers, so that they can be an active participant in developing a treatment plan tailored to their needs.
And again, if you choose to read past this point, be ready to get into the weeds.
__________________________________
Part 2: How To Read Your DXA Report – Body Composition Analysis
Before we start, there are three important points to note that will impact the results on your report.
Firstly, our sample subject below is a mid-30’s Caucasian male. Depending on your age, gender, and ethnicity, there will likely be variations in your personal results.
Secondly, two major companies manufacture DXA machines: Hologic and GE. Each maintains their own in-house “standard reference databases” to compare your numbers to the general population. This means that when comparing two scans done on the same type of DXA machine, there will be standardization; but when comparing scans done on two different types of machines, there will be slight differences. At MHB, we use the Hologic Horizon DXA system.
Finally, we’ve written previously at length about the statistics reported below that compare your data to the general population. This includes the “T-Score” (aka the “Young Normal” or YN column) and “Z-Score” (aka “Age Matched” or AM column). Refer back to that section of the Bone Density blog post for an in-depth explanation, but here is the spark notes version:
When it comes to body composition, we care less about comparing you to men and women in their 20’s. Age Matched is the score we focus on. The number in the AM column reports your percentile rank within the population of people your age and gender, so “50” represents the 50th percentile, or smack average.
Now, let’s dig in.
How do you read your body composition report?

Page 1 of the report presents a summary table of different body tissue “compartments” broken down by regional location. Whenever a body composition is run, the scanner automatically measures bone density to better differentiate fat-free mass or “lean mass” (depicted in the table as Lean + BMC).

Depending on their practice area, providers may focus on different parts of this table. For instance, a physical therapist may care to know that a patient has more fat-free mass (Lean +BMC) in his right arm than his left, as the difference between these two regions may point out muscular imbalances that need to be resolved.
For metabolic and hormonal health, we find that focusing less on regional differences and more on changes in absolute mass benefits most of our patients. For example, if we are working with a patient on lowering body weight, we want to see the “Total Fat Mass” reduced over time, while “Total Lean + BMC” stays relatively constant. In rare cases, lean mass may even increase between scans, though research has proven this goal quite challenging to achieve. In the vast majority of cases where weight is lost, at least some of it will come from muscle and bone. And DXA allows us the opportunity to measure this loss empirically.
Body Fat (Adipose Tissue) Analysis

The one regional analysis we do pay particular attention to is that of visceral adipose tissue (VAT). Each body comp report includes a breakdown of more specific metrics related to the distribution of adipose tissue vs. lean mass. The tables appear as below.
You can see highlighted three particular measurements specifically related to visceral fat (VAT). Research continues to link elevated levels of VAT to a host of cardiac and metabolic issues, including high blood pressure, insulin resistance, and undesirable cholesterol profiles.
While target benchmarks are still under development for the general population, experts currently suggest targeting a VAT area of less than 100 – 160 cm^2 and a VAT volume of less than 500 cm^3.
Additionally, we pay specific attention to the Fat Mass Index (FMI), reported above as “Fat Mass/Height^2”. The best way to think about FMI is that it is essentially the same as BMI if you took muscle mass out of the equation. The table below displays the different risk category groups for comparison.

Muscle Tissue (Lean Mass) Analysis
Of equal importance are the so-called “Lean Indices” which provide direct assessments of both muscle-mass vs. body size (Lean Mass / Height^2 or “LM”) as well as how much of that muscle is located in the arms and legs (Appendicular Lean Mass / Height^2 or “ALM”).

With aging, there is probably no factor more critical to maintaining your independence than your ability to hang on to healthy muscle tissue. Beyond causing reduced quality of life, we know that low muscle mass and frailty is also strongly correlated with accelerating multiple chronic disease states and risk of early death.
Multiple international expert groups have published position statements outlining how to diagnose sarcopenia using DXA technology. While not identical in standards, the general consensus reflects ALM as a uniquely valuable metric. This is not surprising, given that your ability to navigate the activities of daily life depends much more on the strength in your arms and legs than in your core.
For all of our patients, our ideal target is to get them above is the 75th percentile for age matched (AM=75) in both categories. This represents the top quartile for lean mass in their age/gender group. However, this is often a lofty goal, and not always feasible. Just as with all testing, there’s a difference between following the data and getting lost in it.
So at the risk of stating the obvious, the most important thing (really, the only thing) is to work towards improving these metrics steadily over time, regardless of where you start.
How can you get a scan?
DXA scans provide a treasure trove of personal empirical information, especially in the hands of the right interpreter. If you’re interested in body composition analysis, or you’ve had a scan but aren’t sure how to reach your health goals, we’re here to help.
For more information on our industry-leading care at MHB, click here. For a clinical evaluation, call our office or request an appointment with one of our expert practitioners today.